Selecting, Tracking, and Boosting Key Field Service Metrics and KPIs
Field service metrics and KPIs are the backbone of data-driven decision-making — helping you see what’s working, spot what’s not, and take action to improve performance, customer satisfaction, and profitability.
Whether you manage a team of technicians or oversee multiple service regions, having the right metrics in place can transform your operation. But not all metrics are created equal. Some simply describe activity, while others directly relate to business success.
In this article, we’ll explain the differences between metrics and KPIs, discuss the most important ones to track across operations, customer experience, and workforce performance, and share practical tips for improving them.
We'll also discuss how to choose the right metrics for your business and best practices for tracking them accurately.
Let’s get into it.
Differences between field service metrics and KPIs
When managing a field service team, it's easy to lump all performance data together. However, knowing the difference between metrics and KPIs will help you prioritize better.
Metrics are quantifiable measures that track various aspects of your operations. Think of them as raw performance data. They show you what’s happening, but not necessarily why it matters to your business goals. Metric example: Average travel time per job.
KPIs (Key Performance Indicators) are your most important metrics, often reflecting your team’s progress toward strategic objectives — like improving customer satisfaction or reducing operational costs. KPI example: First-time fix rate (if your goal is to improve service efficiency and reduce repeat visits).
In practice, they are often used interchangeably.
Here is a quick overview of all the field service management metrics and KPIs we will cover.
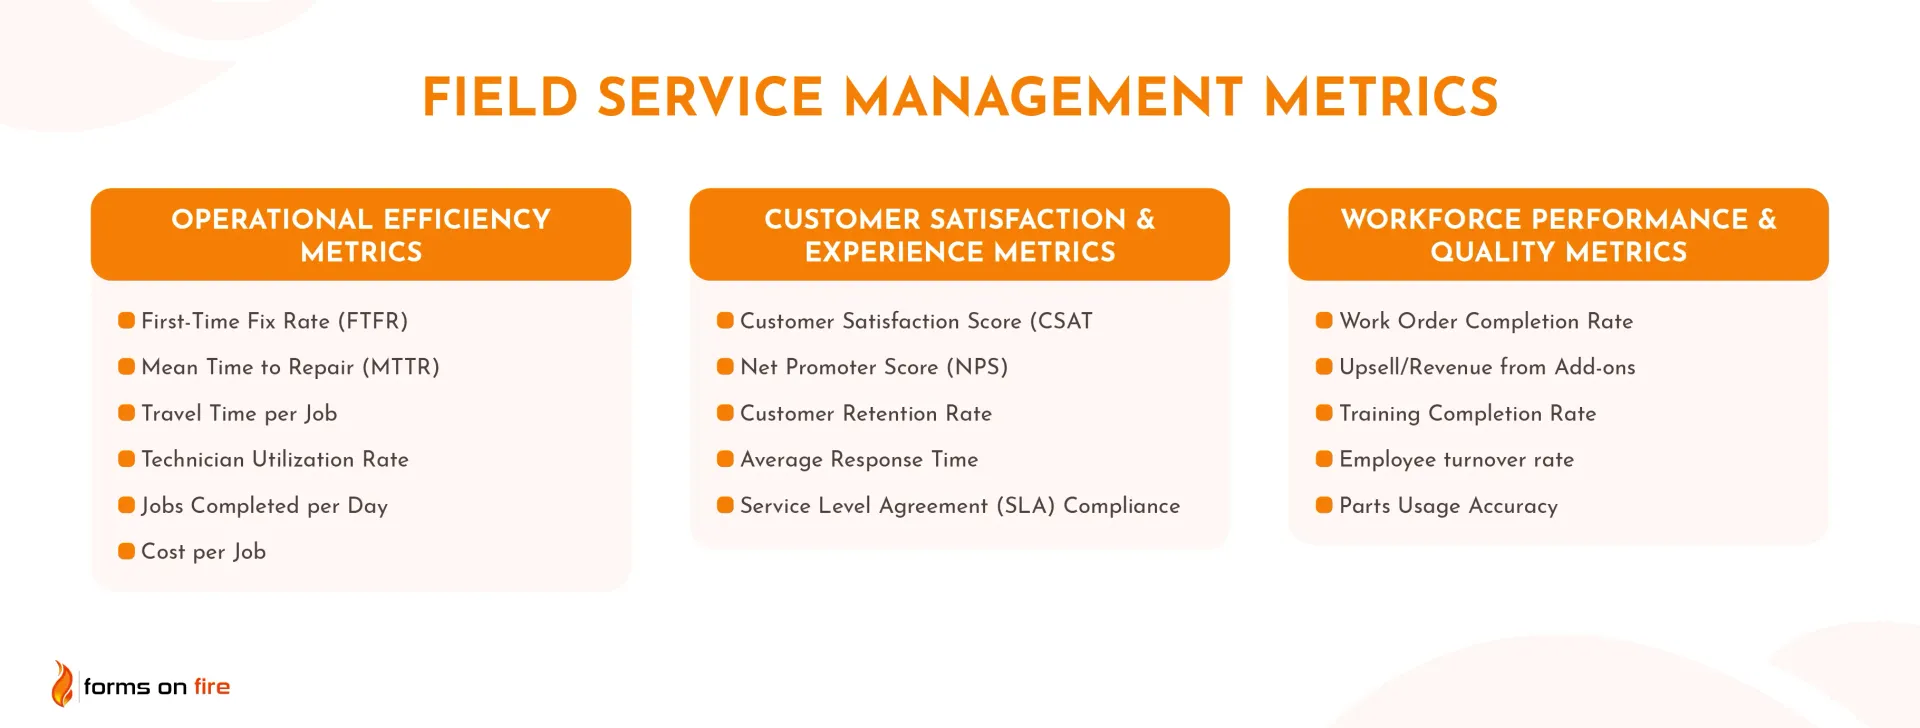
A) Operational efficiency metrics
These metrics help you understand how well your resources (people, time, equipment) are being used and where you might be wasting time or money. Improving these numbers often leads to cost savings, faster service, and happier customers.
1) First-Time Fix Rate (FTFR)
The first-time fix rate measures how often technicians successfully complete a job on the first visit. It's one of the most important indicators of service efficiency and customer satisfaction. If your team is constantly going back to the same site, it’s a red flag for deeper operational issues.
Formula:
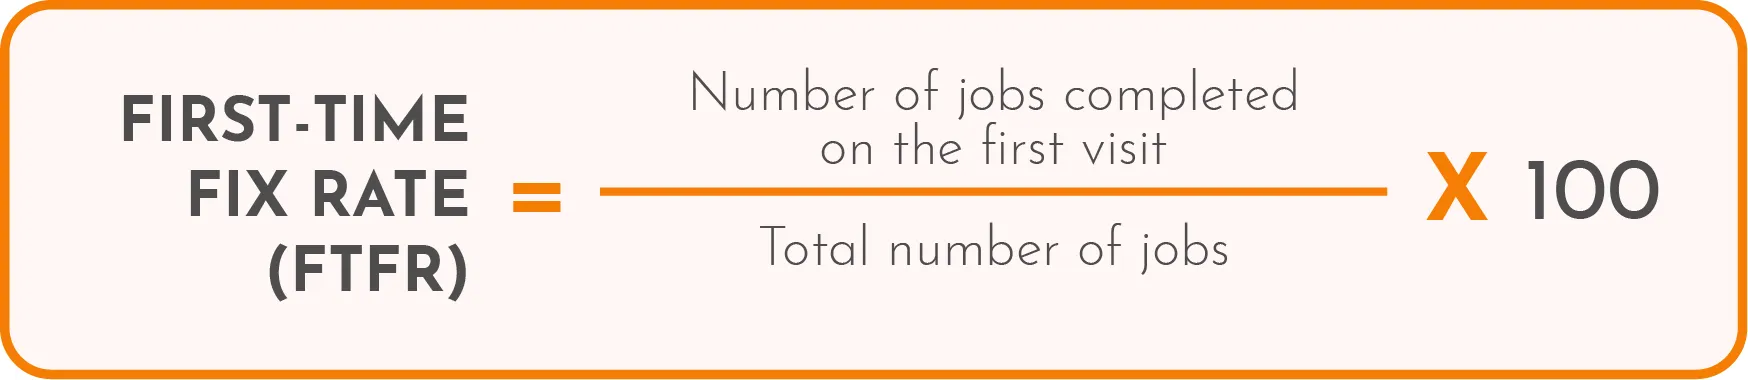
A healthy benchmark to aim for is 70–80%. High-performing field service teams often push that to 85% or more.
Ways to improve FTFR:
- Make sure technicians have the right tools and parts before heading out.
- Provide detailed job info, including customer history and diagnostics.
- Use remote troubleshooting to scope out the issue in advance.
- Offer continuous training on common fixes and new equipment.
- Encourage accurate problem reporting from customers during intake.
- Ensure real-time communication between the field team and the dispatch office.
2) Mean Time to Repair (MTTR)
Mean Time to Repair tells you how long it takes, on average, to fix an issue from the moment a technician starts the job to when it’s resolved. It’s one of the core efficiency metrics.
Here’s how it’s calculated:
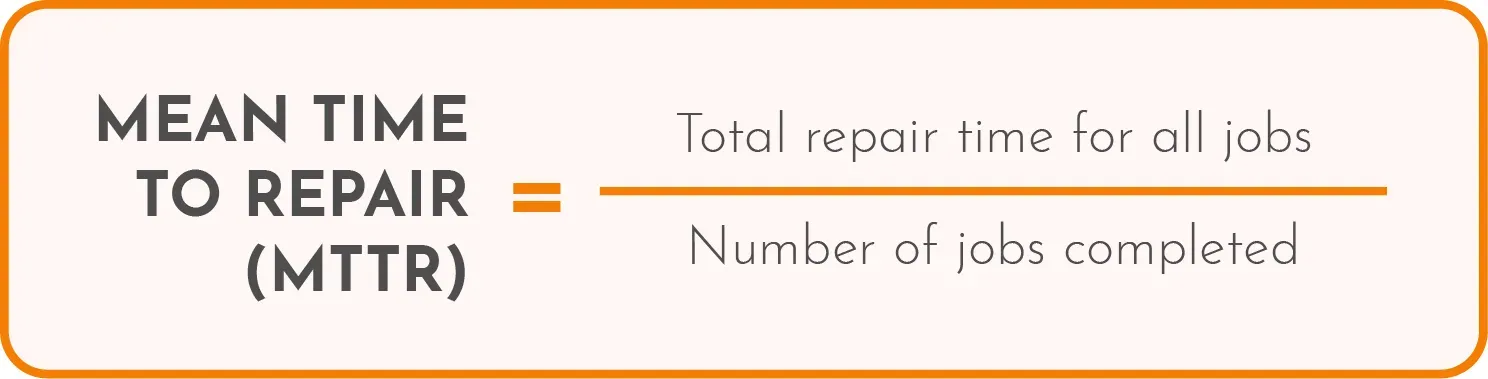
Lower MTTR usually means faster service, higher productivity, and less downtime — but only if the quality of the repair isn’t sacrificed in the process.
How to reduce MTTR:
- Give technicians clear, accurate diagnostics before dispatch.
- Use mobile tools for real-time access to manuals and guides.
- Pre-load vans with frequently used parts and tools.
- Analyze common delays and fix process bottlenecks.
- Assign jobs based on technician expertise and location.
3) Travel Time per Job
Travel time per job tracks how long technicians spend getting to each worksite. While some travel is unavoidable, excessive time on the road usually points to inefficient scheduling or poor route planning — and it eats into time that could be spent doing the work.
Formula:
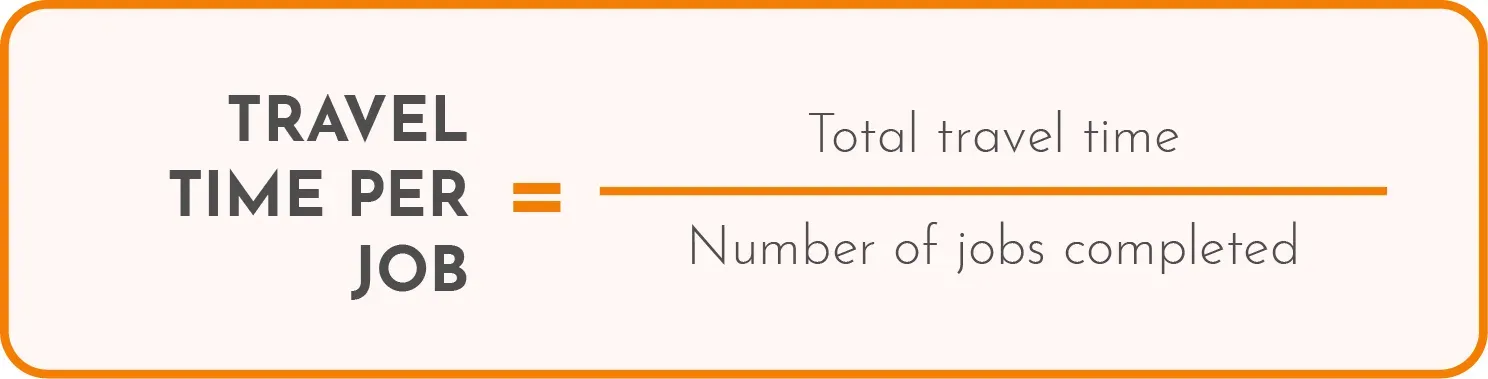
This metric helps you spot scheduling gaps, coverage issues, or routing problems that may hold your team back.
Tips to reduce travel time:
- Use route optimization software or GPS-enabled tools.
- Schedule jobs by proximity and skill set, not just availability.
- Assign technicians to zones or regional clusters.
- Reduce unnecessary trips by resolving simple issues remotely.
- Combine nearby jobs into single technician routes when possible.
4) Technician Utilization Rate
Technician utilization rate shows how much of a technician’s workday is spent on actual, billable service tasks versus idle time, admin work, or travel. It's a useful gauge of how efficiently you're using your workforce.
Formula:
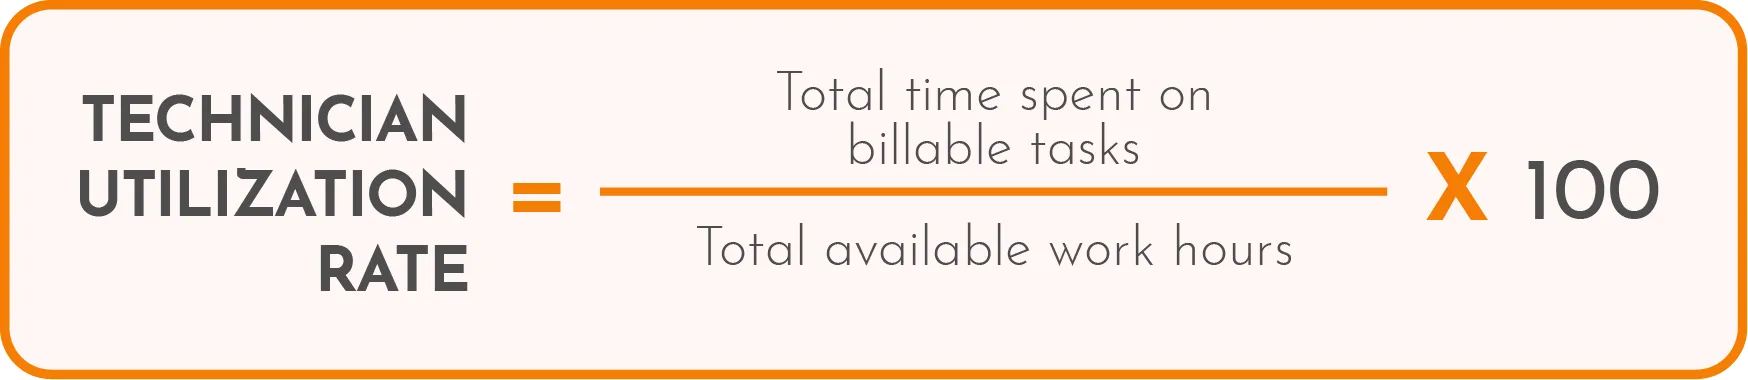
A reasonable utilization rate typically falls between 60–80%, depending on your industry and the type of work being done. Anything too low suggests underused capacity; too high might signal burnout risk or unrealistic scheduling.
How to boost technician utilization:
- Minimize paperwork with mobile forms and automated workflows.
- Improve dispatch accuracy to reduce idle time.
- Shorten the time between jobs with better route planning.
- Analyze scheduling gaps and reassign resources where needed.
- Reduce delays caused by missing parts or unclear instructions.
5) Jobs Completed per Day
This metric tracks the average number of jobs each technician finishes in a single workday. It’s a straightforward way to measure productivity and workload balance across your team.
While more jobs per day often means better efficiency, context matters. If quality or customer satisfaction drops as volume increases, you may be pushing too hard.
Formula:
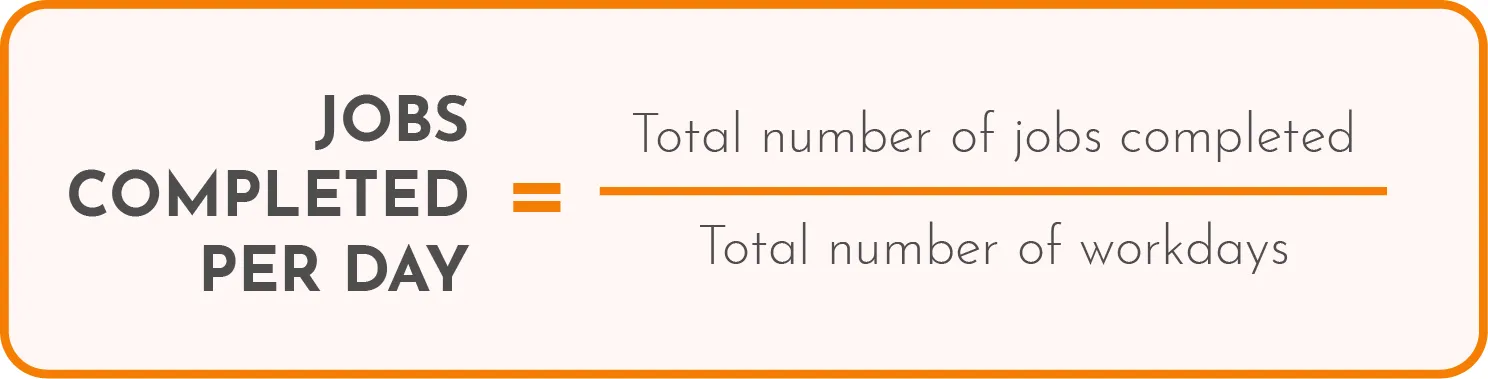
Ideal numbers vary based on job complexity and industry. Tracking trends over time is what matters most.
How to increase jobs per day (without sacrificing quality):
- Streamline job workflows with digital checklists and forms.
- Reduce time spent on admin with automated reporting.
- Improve job scoping to avoid surprises and delays.
- Use smart scheduling to group similar or nearby jobs.
- Monitor performance and adjust workloads accordingly.
6) Cost per Job
Cost per job measures how much it costs your business to complete a single service call, factoring in labor, travel, parts, and overhead. It’s one of the most direct indicators of profitability in field service.
Formula:
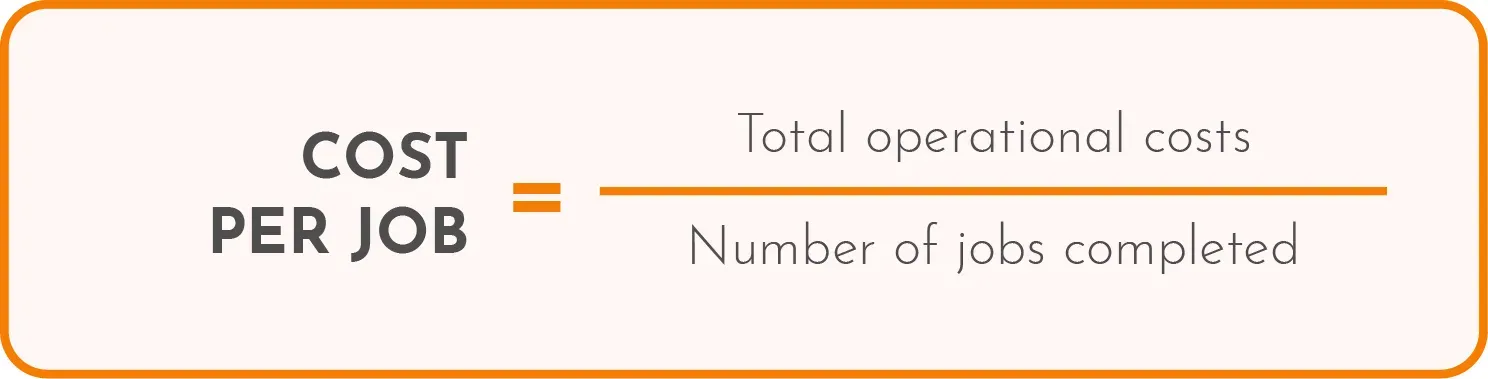
Keeping this number in check helps ensure you’re not losing money on routine jobs or underestimating resource requirements. It's also a great metric to benchmark across teams or regions.
How to reduce your cost per job:
- Optimize technician routes to cut down on fuel and travel expenses.
- Improve first-time fix rate to avoid costly return visits.
- Standardize parts and tools to simplify inventory and reduce waste.
- Automate time-consuming admin tasks.
- Cross-train technicians to handle a broader range of issues on-site.
B) Customer satisfaction & experience metrics
Efficiency matters, but so does how customers feel about your service. Even if your team runs like clockwork, poor communication, long wait times, or unresolved issues can tank your reputation. These metrics focus on the customer’s side of the experience — from how satisfied they are after a job to how likely they are to stick around long-term.
Tracking these helps you pinpoint where your service is falling short and what keeps customers coming back.
8) Customer Satisfaction Score (CSAT)
CSAT measures how happy customers are with a specific service interaction — usually collected through a quick survey right after the job is done.
Formula:
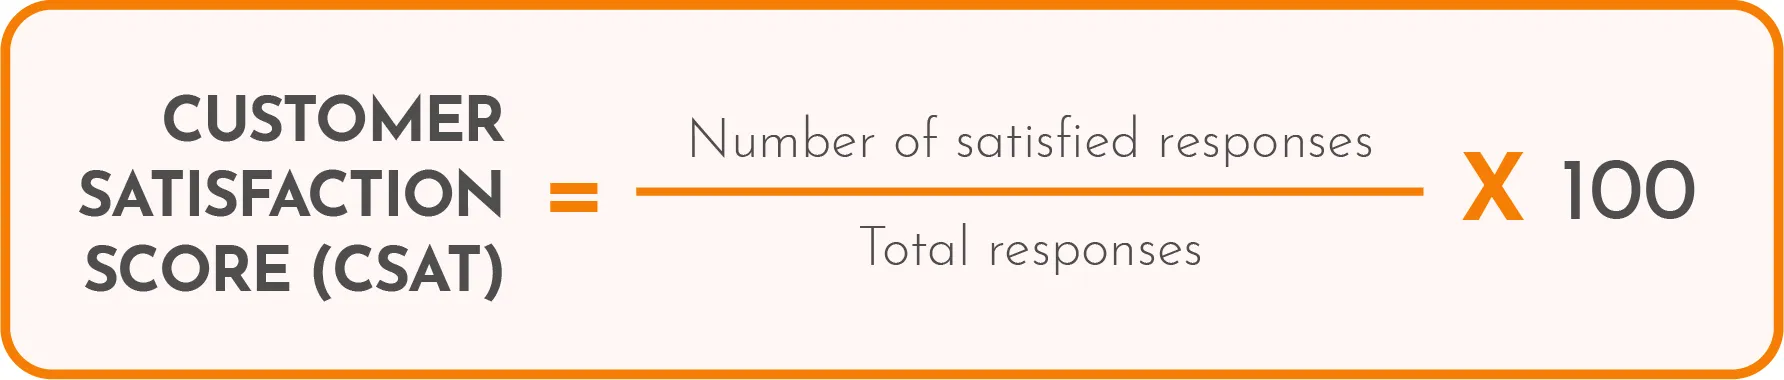
Most CSAT surveys ask customers to rate their experience on a scale (e.g., 1 to 5). A strong CSAT score is typically 80% or higher, though this can vary by industry.
How to raise your CSAT score:
- Follow up after every job with a quick survey, but make it easy for customers to give feedback. Use digital forms to automate this field data collection.
- Set clear expectations before the visit — and meet them.
- Ensure technicians are polite, punctual, and well-prepared.
- Take action on negative responses quickly.
8) Net Promoter Score (NPS)
Net Promoter Score measures how likely your customers are to recommend your service to others. It’s less about individual jobs and more about overall brand perception and loyalty.
Customers are asked: “How likely are you to recommend us to a friend or colleague?” They respond on a scale from 0–10.
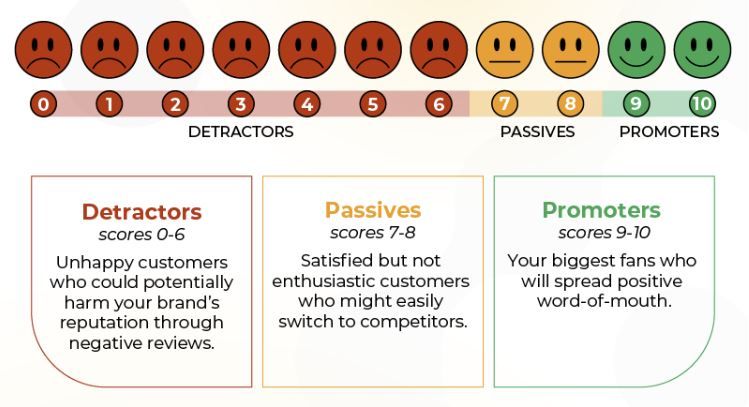
Formula:

A positive NPS is good, but top field service companies often aim for 50+ score.
How to improve your NPS:
- Deliver consistent, high-quality service across the board.
- Resolve issues and complaints quickly and professionally.
- Train technicians to be great with people, not just tools.
- Keep communication clear and proactive.
- Regularly collect feedback and act on emerging trends.
9) Customer Retention Rate
Customer retention rate tracks how well you keep existing customers coming back over time. In field service, where repeat business and long-term contracts matter, this metric is a big deal.
Formula:
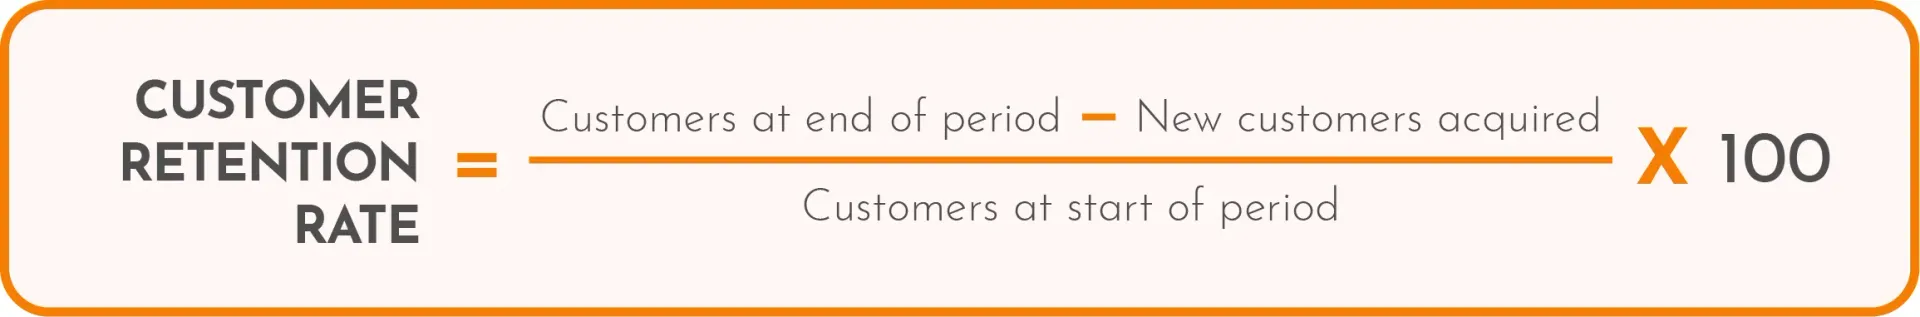
High retention = happy customers who trust your service and see ongoing value. Low retention often signals service gaps, poor follow-up, or uncompetitive pricing.
How to increase retention:
- Offer preventative maintenance programs or service contracts.
- Build strong technician-customer relationships.
- Stay in touch with useful updates or seasonal reminders.
- Follow up after service to collect feedback and ensure satisfaction.
- Reward loyal customers with discounts or priority scheduling.
10) Average Response Time
Average response time measures how quickly your team responds after a service request is made. Whether it’s an emergency repair or a standard job, customers value speed — and long wait times are a common complaint in field service.
Formula:
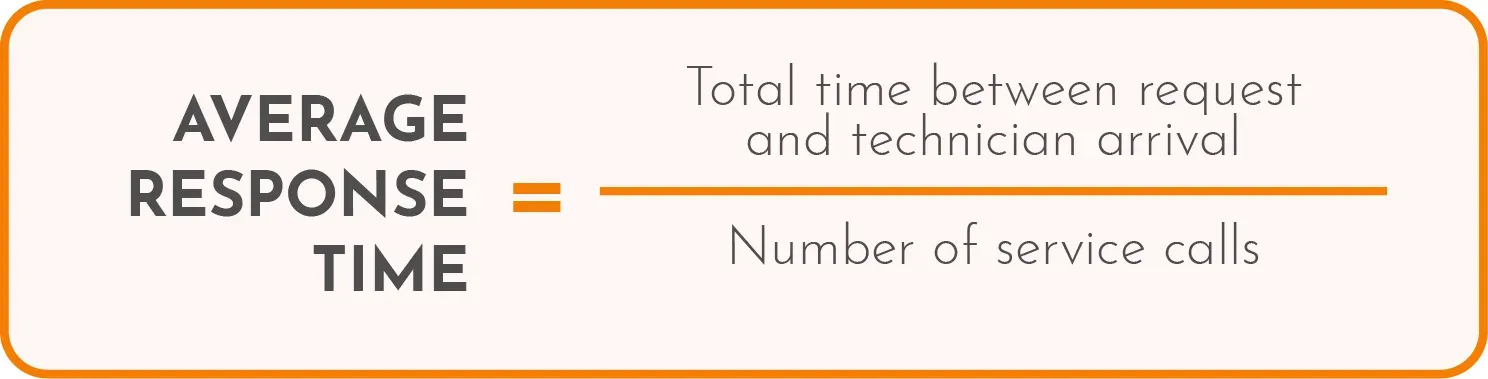
This metric is especially important for SLA-bound jobs or industries where downtime is costly. The “right” response time depends on your service model, but faster is almost always better.
Ways to improve response time:
- Use smart scheduling tools to prioritize urgent jobs.
- Optimize technician routing with GPS and real-time updates.
- Keep technicians' schedules flexible for a quicker dispatch process.
- Use job triage to filter and route requests more efficiently.
- Maintain a reserve of on-call technicians during peak hours.
11) Service Level Agreement (SLA) Compliance
SLA compliance tracks how often your team meets the response and resolution times promised in customer contracts. This is a crucial metric for businesses working with commercial clients or managed services — and tied directly to revenue or penalties.
Formula:
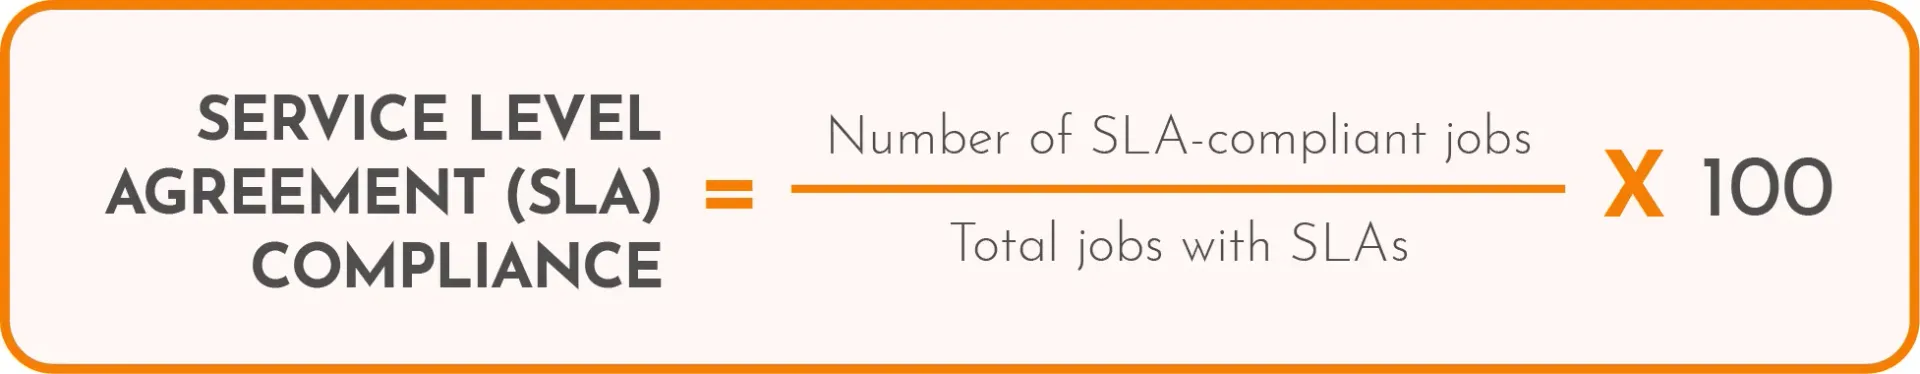
A high compliance rate builds trust and reduces the risk of losing key accounts. Falling behind on SLAs can lead to contract breaches, extra costs, and reputational damage.
Tips to stay SLA-compliant:
- Clearly define SLA terms in job details and dispatch notes.
- Prioritize SLA jobs in scheduling software.
- Monitor SLA status in real-time dashboards.
- Set alerts for at-risk jobs before deadlines are missed.
- Regularly review missed SLAs to identify and address process gaps.
C) Workforce performance & quality metrics
This set of field service performance metrics focuses on how well your team is performing, not just in terms of speed — but also quality, consistency, and value delivered. Monitoring these helps you identify training needs, reward top performers, and improve service quality across the board.
12) Work Order Completion Rate
This metric tracks how reliably your team is closing out assigned jobs. It’s a basic but essential indicator of workload management and operational follow-through.
Formula:
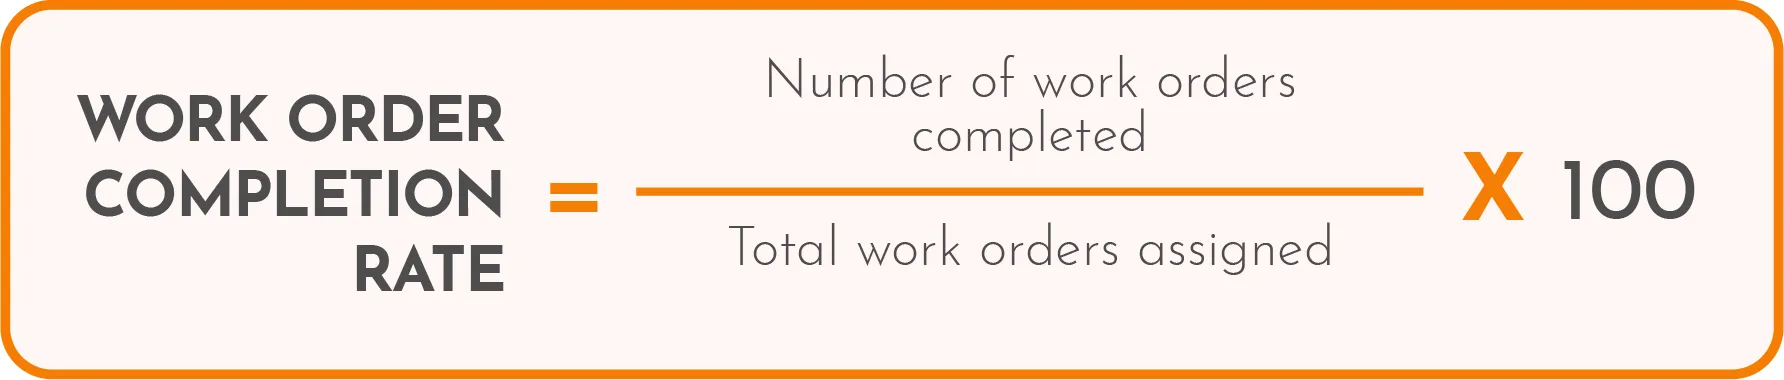
A consistently high completion rate suggests strong execution. Low numbers might point to staffing issues, process inefficiencies, or unclear job scopes.
How to improve it:
- Set clear job expectations and timeframes.
- Provide mobile access to job info, instructions, and customer history.
- Follow up on open or delayed work orders regularly.
- Use automated reminders and escalation paths.
- Track individual and team performance trends.
13) Upsell/Revenue from Add-ons
This metric tracks the additional revenue technicians generate by recommending and selling add-on services, upgrades, or products during a service visit. It reflects both customer trust and technician confidence.
Formula:
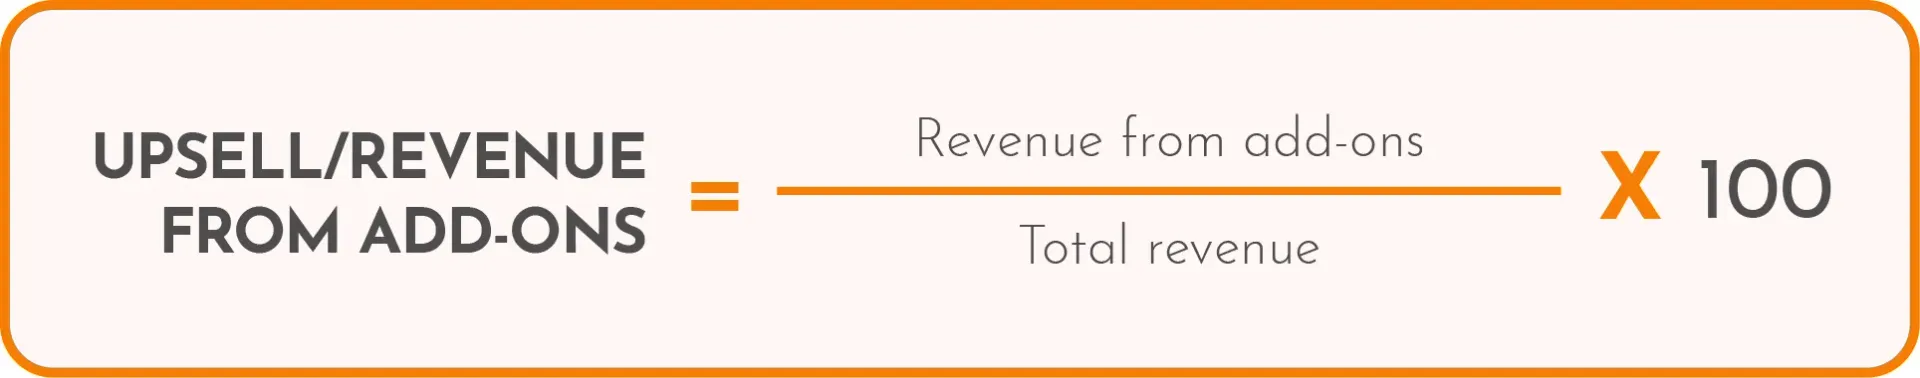
Alternatively, you can track this as a dollar amount per technician or job.
Strong performance here can significantly boost your bottom line, especially if you offer maintenance plans, accessories, or extended warranties. However, be sure not to turn every visit into a sales pitch.
How to increase upsell revenue:
- Train technicians on soft sales skills and when to make recommendations.
- Equip teams with easy-to-understand pricing tools and brochures.
- Offer commission or incentives for qualified upsells.
- Build trust by aligning offers with customer needs — not quotas.
- Track upsell success rates and share best practices across the team.
14) Training Completion Rate
The training completion rate shows how many of your technicians have completed required training programs — whether for onboarding, safety certifications, new equipment handling, or customer service skills.
It’s a key indicator of workforce readiness. If your team isn’t trained, mistakes happen, compliance can slip, and service quality suffers.
Formula:
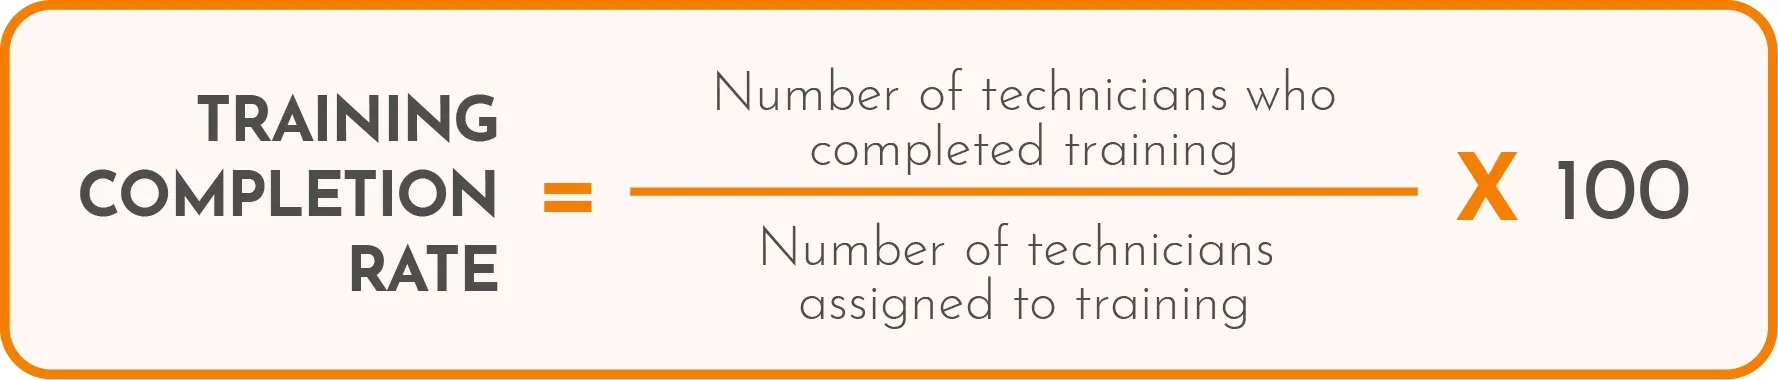
The goal is to keep this rate close to 100%, especially for mandatory or compliance-related training.
How to improve training completion:
- Use mobile-friendly training platforms technicians can access in the field.
- Break training into short, focused modules to keep it manageable.
- Set deadlines and send automated reminders.
- Tie training completion to performance reviews or incentives.
- Track progress in a centralized dashboard and follow up on overdue items.
15) Employee turnover rate
This metric tracks how often technicians leave your organization — either voluntarily or through termination. High turnover can hurt service consistency, drive up training costs, and lower team morale.
Formula:
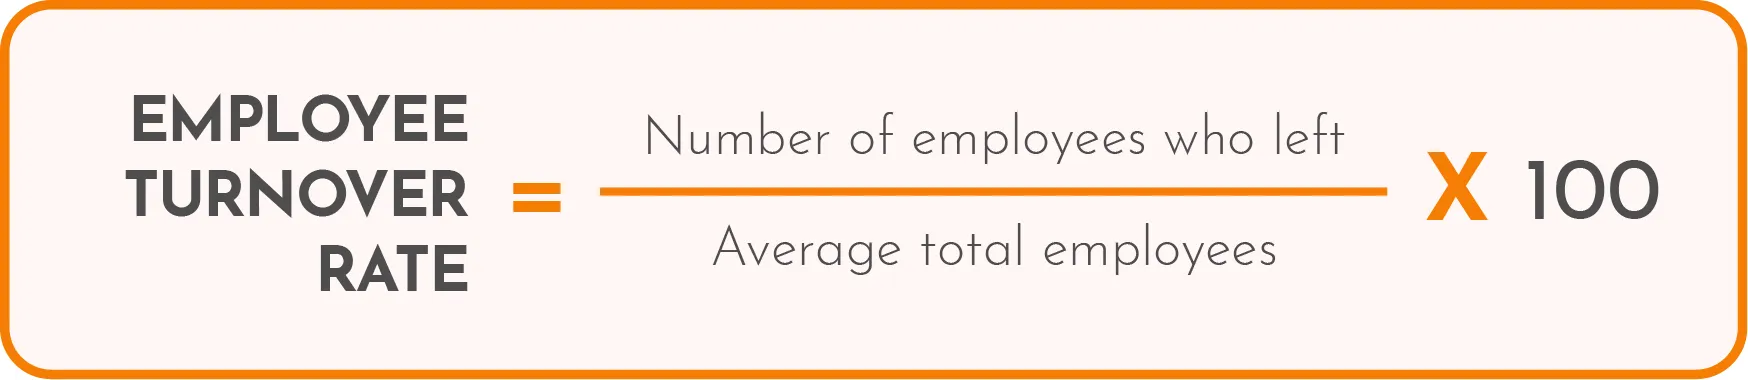
A moderate amount of turnover is normal, but if your rate is climbing, it’s worth looking into causes like overwork, lack of growth opportunities, or poor culture.
How to reduce turnover:
- Provide clear career paths and advancement opportunities.
- Recognize and reward great performance.
- Offer competitive pay and benefits.
- Regularly gather feedback from staff through anonymous surveys.
- Invest in tools that make technicians' jobs easier.
16) Parts Usage Accuracy
Parts usage accuracy measures how closely your technicians’ reported parts usage matches what was actually used and billed. It's all about reducing inventory errors, waste, and billing mistakes.
Formula:

Inaccuracies can lead to revenue loss, stockouts, or customers getting charged incorrectly. This metric is vital for managing a large inventory or doing on-site repairs.
Ways to improve parts accuracy:
- Use barcode or QR scanning for tracking parts and tools.
- Automate inventory updates through mobile apps.
- Train technicians to log parts usage (when something is picked up or returned to inventory) in real time.
- Perform regular inventory audits and spot checks.
- Flag frequent discrepancies for follow-up and training.
How to select the right field service KPIs and metrics to track
With so many metrics, it’s easy to fall into the trap of trying to track everything. The goal isn’t to monitor every stat, but to focus on the numbers that truly move the needle for your business.
Here’s how to make sure you’re picking the right ones:
- Align with your business goals: Start by defining what success looks like. The KPIs you choose should directly support those priorities. For example: Want happier customers? Focus on CSAT, NPS, and response time. Trying to improve profitability? Track cost per job, upsell revenue, and first-time fix rate.
- Involve the right people: Don’t choose metrics in a vacuum. Loop in team leads, dispatchers, technicians — even customer service reps. They’ll help you understand which numbers reflect real performance and where improvements are most needed.
- Use SMART criteria: Follow the SMART format when defining goals and subsequent KPIs.
By narrowing your focus and aligning your metrics with real-world goals, you’ll avoid dashboard clutter and make your data more actionable.
Best practices for tracking field service metrics accurately
Tracking any field service KPIs loses its point if the data behind it isn’t reliable. Here are a few things you can do to ensure your metrics reflect what’s happening in the field.
1. Digitize your field operations
Paper forms, spreadsheets, and phone calls just don’t cut it anymore. Use mobile apps and cloud-based platforms to capture job data in real time. This reduces errors, speeds up reporting, and gives everyone access to the same information.
2. Automate data collection where possible
Don’t rely on technicians to manually log every detail. Use tools that automatically record timestamps, GPS locations, parts usage, and job completion data. The less manual input required, the more accurate and consistent your metrics will be.
When manual input is needed, use data validation to ensure data integrity. If you are creating custom mobile forms that technicians will use in the field, follow mobile forms design best practices.
3. Ensure data integrity and technician buy-in
Bad data often comes from confusion or inconsistent processes. Standardize how data is collected in the field, and make sure technicians understand why it matters. Show them how tracking performance can lead to better tools, less admin work, and recognition for good work.
4. Regularly review and audit your dashboards
Don’t just “set and forget” your KPIs. Make time to:
- Spot-check unusual data points
- Identify trends and outliers
- Adjust or retire metrics that aren’t providing value
- Share insights with the team to drive improvement.
Tracking metrics isn’t just a reporting task — it’s a leadership habit. When you trust your data, you can confidently lead and make changes that actually stick.
Create a cost-efficient field service operation with Forms On Fire
If you're serious about tracking and improving your field service metrics, the right tools make all the difference. That’s where Forms On Fire comes in.
Forms On Fire is a no-code platform built to streamline all aspects of field operations:
- Build a portal for service request forms.
- Create digital work orders that can be checked off with digital signatures.
- Create custom digital forms and checklists for inspections, job tracking, parts usage, etc.
- Auto-sync data from the field to your dashboard — no more chasing paperwork.
- Trigger alerts and workflows based on SLA deadlines or job status.
- Integrate with your existing CRM, ERP, or scheduling tools.
- Make better decisions with accurate, automated, real-time reporting.
- And much more.
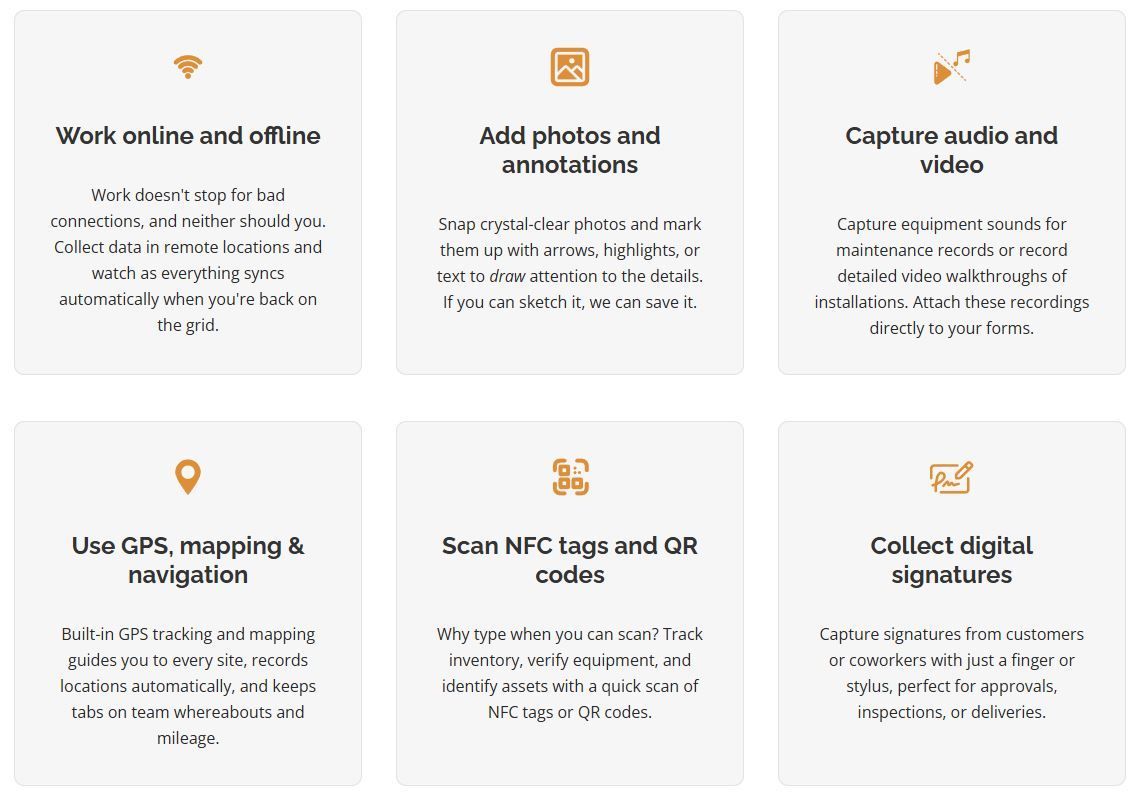
We do that with bunch of awesome, bulit-in features field teams love:
You just have to log in, choose one of our existing form templates, modify them to fit your workflow, and you are good to go. If you get stuck, our amazing support team is here to help — from building forms to deploying them to your field team’s mobile device.
Schedule a demo and tell us what you are trying to do — and we will show you how Forms On Fire can help.